The cryptocurrency market is known to be very volatile. Navigating this dynamic environment requires a robust toolkit, as well as technical analysis stands as a cornerstone for successful crypto trading. Whether you are a beginner looking to understand the basics or a seasoned trader aiming to refine your strategies, this guide will provide you with valuable insights and practical tips.
What is Technical Analysis?
Technical analysis is a method of evaluating securities by analyzing market data, such as past prices, trading volumes, and market trends, based on its historical price and volume data. The fundamental analysis takes into account the intrinsic value of an asset, but technical analysis bases its judgment entirely on charts and indicators to pick up patterns and trends.
Technical analysis traces its history back to the early 1900s through Dow Theory developed by Charles Dow, a founder of Dow Jones & Company. Dow Theory believes that all known information in the market is reflected in prices, and movements are not arbitrary but follow recognizable patterns over time.
Why Technical Analysis is of Paramount Importance for Crypto Trading?
High Volatility:
The nature of the cryptocurrency market is more volatile, leading to extreme value fluctuations within narrow time frames. Technical analysis also helps mark entry and exit points, helping to reduce as much risk.
Identifying trends:
By assessing price charts, traders can also identify trend directions (a rising trend or a falling pattern or a deadlocked trend).
Predicting Market Reversal:
Technical analysts can predict significant turning points through price trends before the market happens.
Risk Management:
Technical analysis tools such as stop-loss orders may be used to control the potential loss.
Key Concepts in Technical Analysis
Price Chart:
Technical analysis relies on the use of price charts. They represent every change in price over time, making it easier to pick trends and patterns. The most commonly used price charts include line charts, bar charts, and candlestick charts, mainly when trading in cryptocurrency.
Line Charts:
Simple and easy to read, line charts display the closing prices over a period of time. They are useful for getting a quick overview of the overall trend but lack detailed information.
Bar Charts:
More than lines, bar charts will provide open, high, low, and close for each time period. One bar is equal to one period and also has a length, which shows a range of price.
Candlestick Charts:
Candlestick charts are a graphic representation of price movements in a given period. This provide more information with open, high, low, and close prices, and are also useful for identifying market sentiment. Each candlestick consists of a body (the difference between the open and close) and wicks (the high and low prices). Candlestick patterns, such as doji, hammer, and engulfing patterns, can provide valuable insights into potential market reversals.
Trends:
An identification of trends in technical analysis is necessary. Trends describe the overall trend or general direction of price movement for a particular asset, which can further be divided into three categories, such as uptrends, downtrends, and sideways trends.
Uptrend: The prices make a higher high and then form higher lows in an uptrend, making the market more bullish. Trading during the retracement of price movements is preferred while the market remains in an uptrend.
Downtrends: In a downtrend, the pattern of lower highs and lower lows defines bearish market conditions. Sellers and short-sellers look for a rally to sell or short in a downtrend.
Sideways Trends: These are known as ranging markets where prices are horizontal within a range. During a sideways trend, traders might be looking for breakout opportunities or trading in the range.
Support and Resistance Levels
Support and resistance levels are the concepts of technical analysis, which show price levels where buying and selling pressures tend to reverse.
Resistance: Resistance level is the price level where upward trend is supposed to pause because there is a concentration of selling interest. At that point, once the price has reached the resistance level, the price will more than likely fall back down. If the price breaks above the resistance level, it might have further upward motion.
Support: A support level is the price level at which a downtrend is likely to pause due to a concentration of buying interest. When the price reaches the support level, it is likely to bounce back up. If the price breaks below the support level, then it may be a sign of further downside.
Indicators and Oscillators
Technical indicators and oscillators, on the other hand, involve mathematical calculations depending on price and volume data; they help spot potential trading opportunities. Some commonly used indicators and oscillators are:
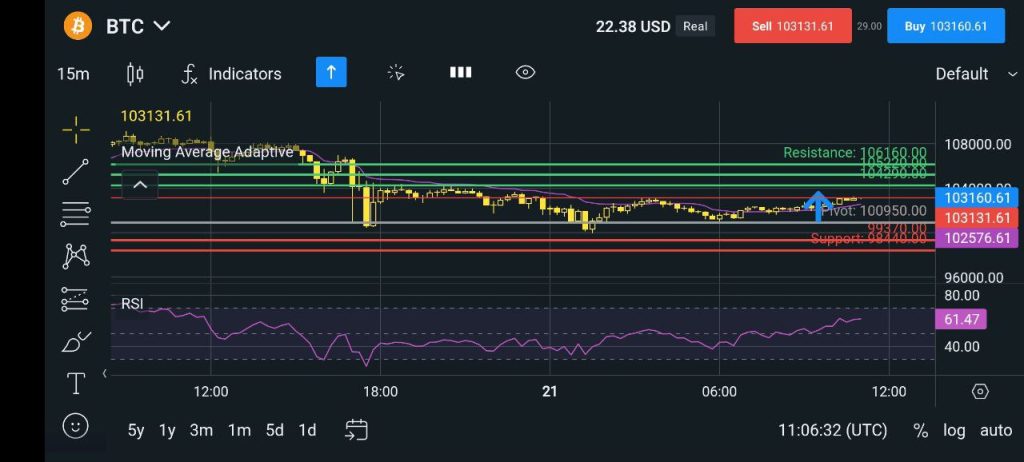
Moving Averages: Moving averages are used to smooth out price data to determine the direction of the trend. The two main types are simple moving averages (SMA) and exponential moving averages (EMA). Moving averages can also be used to generate buy and sell signals, such as when the price crosses above or below the moving average.
Relative Strength Index (RSI): The RSI measures the speed and change of price movements to identify overbought or oversold conditions. The RSI ranges from 0 to 100, with levels above 70 indicating overbought conditions and levels below 30 indicating oversold conditions.
MACD also means Moving Average Convergence Divergence. That outlines the relationship between two moving averages and detects changes in momentum. This includes the MACD line, which is the difference between the 12-period and the 26-period EMA; the signal line, which is the 9-period EMA of the MACD line; and the histogram, which is the difference between the MACD line and the signal line. Buy and sell signals are given when the MACD line crosses above or below the signal line.
Patterns
Chart patterns are shapes and formations that occurs on price charts, revealing valuable information concerning future price action. Some of the most frequently used patterns in technical analysis include:
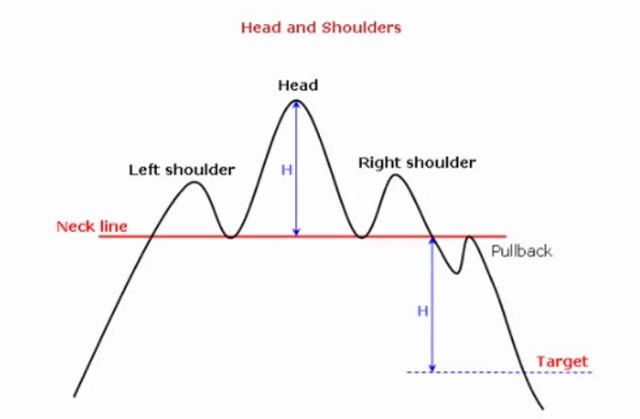
Head and Shoulders: Reversal pattern that indicates the change in the direction of trend. The pattern is also characterized by three peaks; the highest one is the head between two smaller ones, shoulders. A breakout below the neckline confirms the pattern and then may trigger a downtrend.
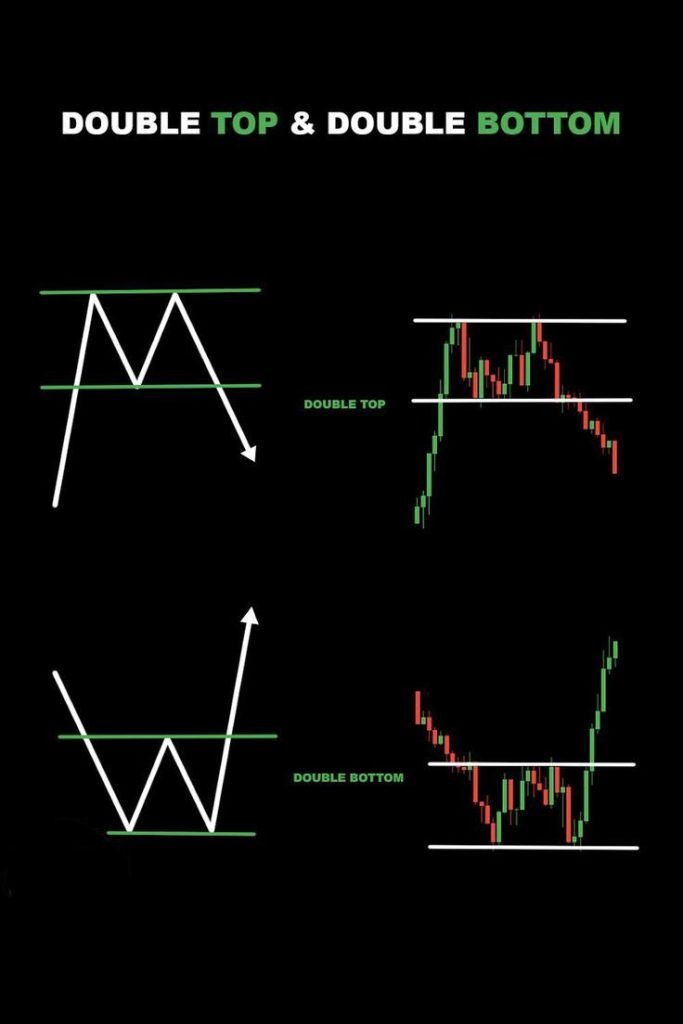
Double Tops and Bottoms: Reversal patterns that indicate potential trend changes. A double top occurs after an uptrend, with two peaks at roughly the same level, as well as followed by a break below the support level. A double bottom occurs after a downtrend, with two troughs at roughly the same level, followed by a break above the resistance level.
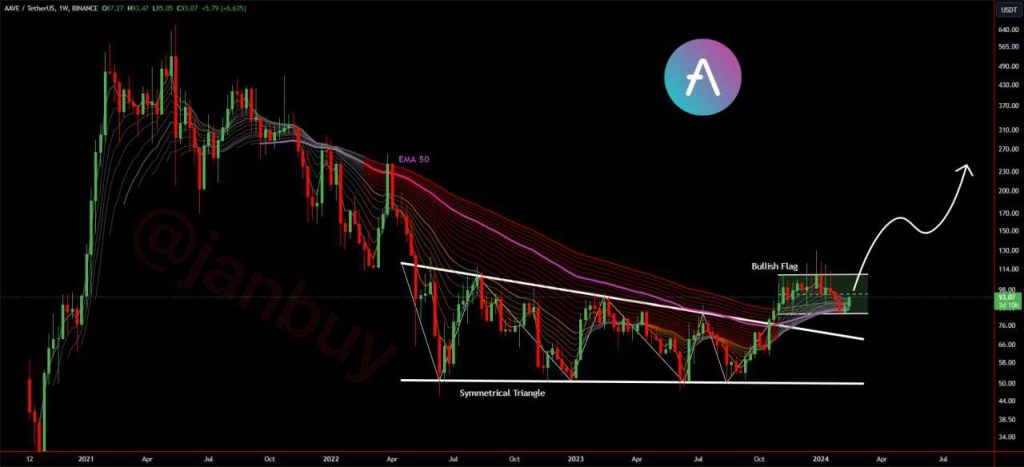
Triangles and Flags: Continuation patterns that indicate the current trend will continue. Triangles are formed when the price consolidates within converging trendlines, while flags are formed as small rectangular consolidations after a strong price movement. A breakout from these patterns in the direction of the prevailing trend confirms the continuation.
How to Use Technical Analysis for Crypto Trading
Select the Right Tools
To use technical analysis effectively while trading in the crypto market, one needs to select a suitable toolset and platform. Reliable charting platforms like TradingView offer plenty of indicators and tools along with real-time data for making intelligent decisions. Secondly, keeping an eye on up-to-date information about the most recent crypto news and market is also important.
Strategy Development
A good trading strategy is the best way to get successful in crypto trading. This means you can define your entry and exit points based on technical indicators and chart patterns. So, for example, you would enter a trade when the price breaks above a resistance level or when the RSI indicates an oversold condition. Set your stop-loss orders to manage the risk and protect your capital. Combining several indicators to confirm signals can minimize false positives and improve the accuracy of your trades.
Practice and Learn
Practice is essential for mastering technical analysis. Start with a demo account to practice your skills without risking real money. This allows you to test different strategies and learn from your mistakes in a risk-free environment. Continuously learning and adapting to changing market conditions is also important. Follow crypto news, join trading communities, and stay updated with new developments in technical analysis.
Stay Disciplined
Discipline is crucial for successful trading. Stick to your trading plan and also avoid making emotional decisions based on fear and greed. Keep a trading journal moreover to track your performance, analyze your trades, and identify areas for improvement. By staying disciplined and consistently following your strategy, you can improve your trading skills and increase your chances of success.
Conclusion
Mastering technical analysis for crypto trading takes time, practice, and continuous learning. Once you understand key concepts, know the right tools to use, and develop a disciplined approach, you will see improvements in your trading skills, thus increasing the chances of succeeding in the volatile crypto market. Successful trading is not only about making profits but also about managing risks and learning from experiences.
Happy trading!
Subscribe to our newsletter!